
How to review data
Content
All farmer data collected by data collectors needs to be reviewed and approved by the local partner. This process happens in the Local Partner Portal. This article will guide you through how to navigate and review the data effectively, covering the following topics:
The dashboard
The farmer table
Reviewing data from the farmer table
Recognizing problematic data
Using DCT’s plot review feature
Next steps after reviewing data
The dashboard
The Local Partner Portal consists of several apps: the Data Collection App, the Data Management App, and the EUDR App. To learn more about the data collection process, refer to this article, and for insights into managing data, refer to this article.
When you open the Data Collection App in the Local Partner Portal, you’ll see a dashboard that provides an overview of all collected plots and farm statistics. Scrolling through this dashboard gives you a quick sense of the overall data quality. If you spot any plots that need attention, simply click on them to go directly to the farmer's profile. While this method works well for small projects, as your number of plots grows, it becomes harder to manage. In such cases, the Farmer Table provides a more structured view.

The farm table
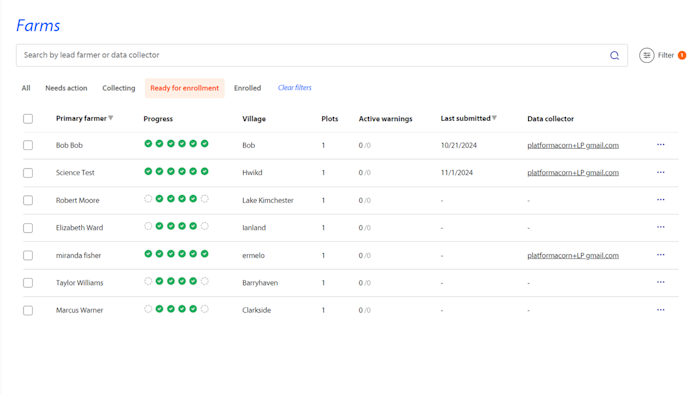
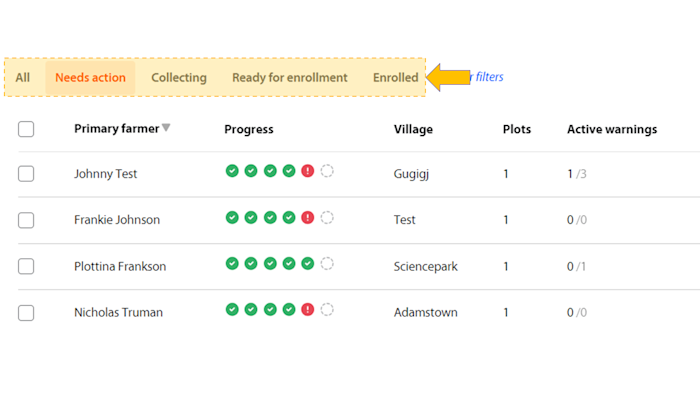
The farm table offers an overview of your project's data, making it easier to manage and review multiple farm profiles. Above the table, you will find four quick filters: All, Needs Action, Collecting, Ready for Enrollment, and Enrolled. These filters allow you to group farmers based on their current profile status.
For more specific filtering, use the Filter button next to the search bar.
Farm profile progress bubbles
There is a column in the farm table called 'Progress'. This column displays different green, red or white bubbles for each farm profile. Each bubble represents a part of the farm profile:
1. The first bubble shows whether a Data Collector is assigned to the profile. If a Data Collector was assigned, the bubble will be green. Otherwise, it will be white.
2. The second bubble represents the Data Sharing Consent. If the consent is collected and valid, the bubble will be green. Otherwise, it will be red.
3. The third bubble represents the Participant Agreement. If the agreement is collected and valid, the bubble will be green. Otherwise, it will be red.
4. The fourth bubble represents the farm data. If the data is collected and complete, the bubble will be green. Otherwise, it will be red.
5. The fifth bubble represents the plots. If at least one plot is collected, and all collected plots are valid, the bubble will be green. Otherwise, it will be red.
*6. Some projects will have a sixth bubble. This is a project-specific setting called profile sign-off. If it's there, the sixth bubble shows whether a profile was signed off by you or not. If it was signed off, the bubble will be green. Otherwise, it will be red.
Quick filters
Quick filters help group farm profiles based on their progress. Here's what the different quick filters mean:
All: Shows all farm profiles in your project.
Needs action: Shows profiles with at least one red bubble.
*If your project uses the profile sign-off feature, any profiles that weren't signed off yet will also be included.
Collecting: Shows any profiles that are being recollected by a Data Collector.
Ready for enrollment: Shows profiles with no red bubbles.
*If your project uses the profile sign-off feature, you will need to sign off a profile before it will move to 'Ready for enrollment'.
Enrolled: Shows all enrolled profiles in your project.
Checklist for data quality checks
the progress bubbles are only automated, technical checks. This does not always guarantee that the data is of high quality. Therefore, a final review is necessary to be done by the Local Partner.
For each profile, you need to check:
Participant Agreement: Is it available (on paper or PDF)? Is it signed and readable?
Data Sharing Consent: Is it available?
Plot: Is it located realistically? Does it have too many buildings or roads? Does the plot follow the farm’s natural boundaries? Does it have enough markers? Are there any warnings placed on the plot?
Farmer details: Are contact details accurate? Do the phone number and email belong to the farmer?
After checking a farm profile, you can edit any parts of the profile that can be changed without recollection. Take note of what needs to be recollected by a Data Collector.
Reassign, Recollect, Remove, edit or Sign-off the profile according to your judgement. Use this guide for more detailed instructions. If you choose to recollect a profile, make sure to provide the responsible Data Collector with clear instructions to ensure a successful recollection.
Using quick filters for data quality checks
To make you data quality checks easier, you can decide to do the checks in a certain order. The quick filters can be used for this:
Step 1: Review 'Ready for enrollment' farm profiles*
Click on the 'Ready for enrollment' quick filter and check the profile using the checklist described above. --> *If your project uses the profile sign-off, you will need to click 'Needs action' and filter on 'Ready to complete'. This can be done in the detailed filters next to the search bar.
Step 2: Review 'Needs action' farm profiles*
Click the Needs action quick filter and check the profile using the checklist described above.. --> *If your project uses the profile sign-off, you will need to click 'Needs action' and filter on 'Incomplete'. This can be done in the detailed filters next to the search bar.
Step 3: Monitor 'Collecting' farmers
Click the Collecting quick filter and check the profile using the checklist described above.
Farmers with the 'Collecting' status are currently being handled by a Data Collector, so their data does not need immediate review. However, you can track their progress and check if the recollection isn't taking too much time. If you notice anything, you can contact the responsible Data Collector to check that everything is going well.
Recognizing problematic data
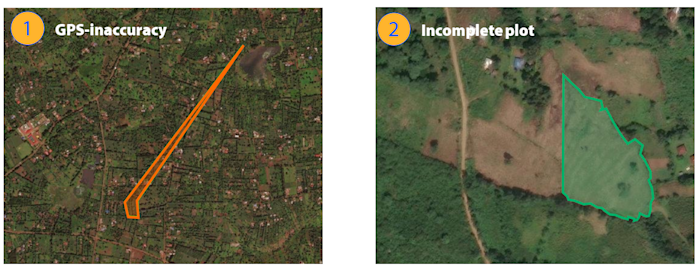
When reviewing data, you may occasionally encounter problematic data. This can be caused by technical issues like GPS inaccuracies, human errors such as incomplete plots, or even intentional falsification. It’s important to identify these issues to maintain data quality. Here are some examples of problematic data:
Types of problematic data
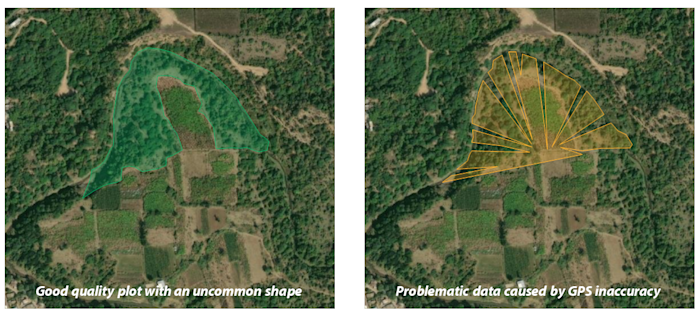
Unnatural shape
In DCT, automatic warnings will be placed on plots with unnatural shapes. This is done in an effort to make data checks easier for a local partner. Plots with this warning could contain falsified data or GPS inaccuracies. In such cases, arrange for recollection with the responsible data collector. However, sometimes a plot of land might have an uncommon shape without it containing problematic data. In that case, the warning can be ignored and the plot can be enrolled. It is up to the local partner to decide whether a plot with an unnatural shape seems problematic or not.
Partial area of farm
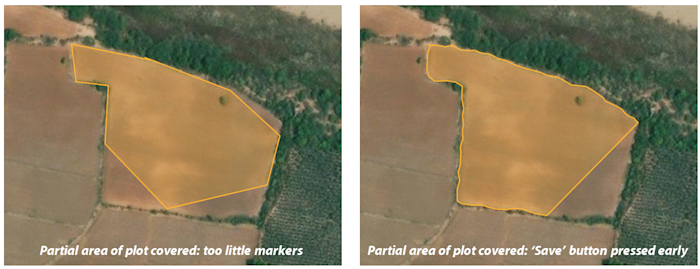
If the Data Collector forgets to place markers or saves the plot too early, the farm area might be incomplete. In both cases, the tracked plot will inaccurately represent the farm. To ensure a fair CRU amount to the farmer, recollection is needed to verify farm size and boundaries.
GPS inaccuracy
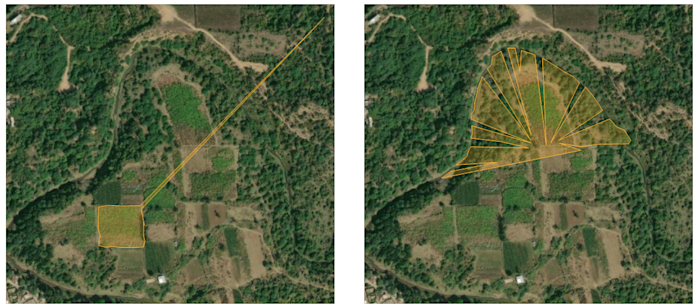
Misplaced markers due to GPS errors can create odd plot shapes. You can either fix the plot by deleting incorrect markers or arrange recollection. This choice depends on the severity of the GPS inaccuracy.
Unnecessary amount of buildings
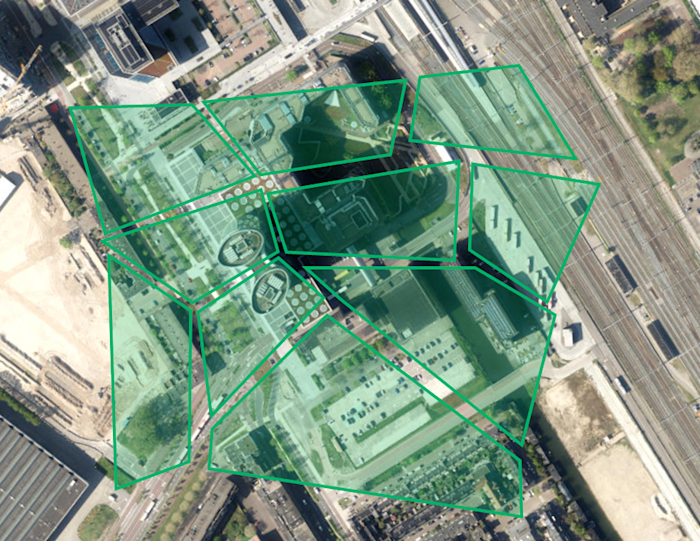
Generally, a plot should contain only the 'green' parts of the farm. Buildings, roads and bodies of water are therefore left out while tracking. In cases when a building, road or small lake is in the middle of the farm, it can usually be left in the plot. As a rule of thumb, plots should not contain more than 20% buildings, roads or lakes. If you encounter a plot in this category, you can either delete it, recollect it or edit it without revisiting the farm.

Intentionally falsified data
Recognizing problematic data due to technical or human error is generally easier than recognizing falsified data. Falsified data might contain any of the mentioned problematic data types above but it can also show any of the following characteristics:
Unrealistic farmer data, such as a fake phone number.
Missing participant agreement.
However, it is important to note that falsified data is not limited to these characteristics. It is therefore important to always contact a data collector if you have any doubts regarding the data they collected.
Characteristics of high-quality data
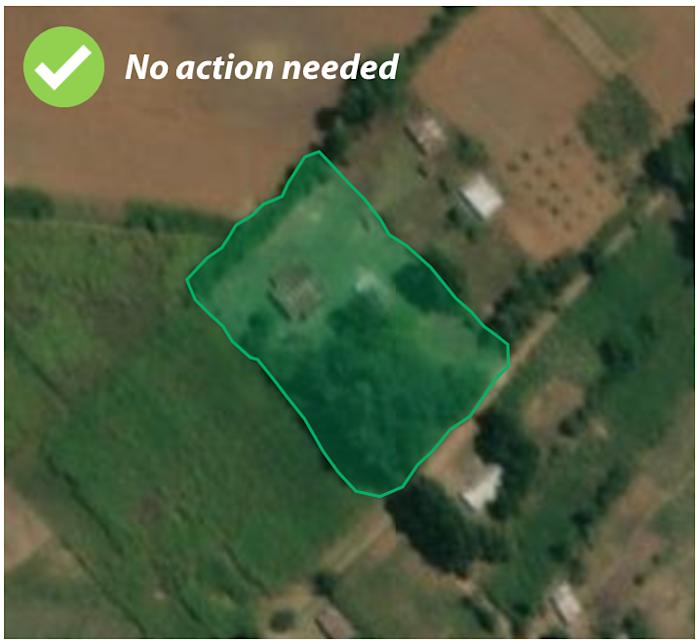
High-quality data is easy to spot with these key characteristics:
Natural plot shapes matching satellite images
Adequate markers placed around the farm, preferably with auto-tracking
No GPS inaccuracies
Full farm area covered
No unnecessary buildings, roads, or bodies of water
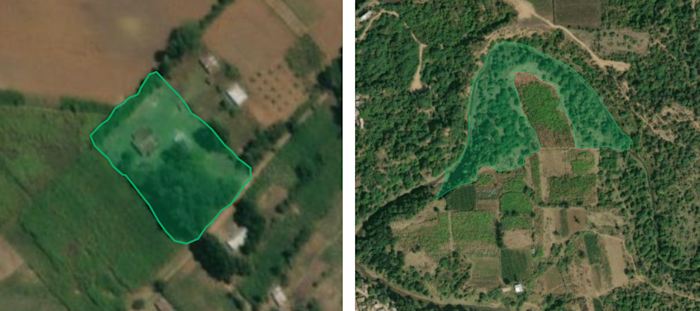
Using DCT's plot review feature
The Plot review feature allows you to quickly assess farmer plots and make decisions about recollection or enrollment. You’ll see an image of the plot along with surrounding plots and any warnings.
To access the Plot Review feature:
Open the Local Partner Portal.
Click on Plots in the left-hand navigation panel.
In the top-right corner, click Plot reviews (beta).
Warnings for a plot will appear on the right side of your screen. You can ignore the warnings if the data is correct or proceed with recollection if needed. Use the Next and Previous buttons below the plot image (or the left and right arrows on your keyboard) to quickly review different plots without opening each profile individually.

Next steps after reviewing data
Once you have reviewed your data and are confident it’s ready for enrollment, you’ll need to contact your Account Manager. Only Account Managers can enroll farmers via the DCT portal. Let them know which profiles are ready, and they will perform any final checks before completing the enrollment process.